In any country, the state of public healthcare will always find itself under intense scrutiny. In recent times, however it feels like it is under the spotlight even more than usual. Just take a look at the NHS in recent months, whether it’s waiting times, ambulance responsiveness or bed shortages – the UK healthcare system is having to cope with these challenges with the added pressure of reduced budgets, an ageing population and increased demand.
While the challenges are great, we should be hopeful as there are innovations that are being deployed today that are easing these issues. Technology is playing a large part in this, with data analytics and visualisation helping healthcare organisations deal with some of its greatest challenges; waiting times, clinical variation and moving to a population healthcare approach. We take a look at some of the best examples, from the UK, Europe and beyond.
This program has reduced adverse events by 18%, reduced reoperation by 17%, increased the number of surgeries by a staggering 44% and as a result, reduced waiting time by more than 40 days for hip and knee replacements. This was only possible by engaging clinicians with data, uncovering variations and dispelling widely held myths.
By putting analytics into the hands of employees at the point of decision and empowering data-driven decisions to be made at all levels, its A&E department has been able to decrease patient waiting times by thirty minutes.
By creating a dashboard and collaborating on data across all 19 communities in the region, the organization was able to reduce the total time from the first emergency call through to the life-saving operation by up to 20 minutes. Not only does this help save lives but means that the quality of life following the operation is improved as treatment commenced at an earlier stage.
One of the main challenges is creating a culture of data literacy – the ability to not only read but understand, analyse and work with data – across the healthcare system. The ones that really deliver results are those that have clinicians as key stakeholders in the process and where the data is accessible and relatable to hospital staff from ward to board. That means approaching healthcare analytics from a 360-degree view perspective.
This checklist is based primarily on lessons from the healthcare transformation, improvement and analytics front-lines as we’ve seen from these examples. However, a one sized approach does not fit all, and the best analytics strategies are those that are aligned to an organization’s specific characteristics, potential and limitations.
While the challenges are great, we should be hopeful as there are innovations that are being deployed today that are easing these issues. Technology is playing a large part in this, with data analytics and visualisation helping healthcare organisations deal with some of its greatest challenges; waiting times, clinical variation and moving to a population healthcare approach. We take a look at some of the best examples, from the UK, Europe and beyond.
Sweden, Sahlgrenska hospital
Sahlgrenska in Sweden is one of largest hospitals in Northern Europe, and like many organizations has struggled with clinical variation. However, the use of data analytics has enabled them to make great progress addressing this issue by working on a value based care program which specifically uncovered variation in Orthopaedic care.This program has reduced adverse events by 18%, reduced reoperation by 17%, increased the number of surgeries by a staggering 44% and as a result, reduced waiting time by more than 40 days for hip and knee replacements. This was only possible by engaging clinicians with data, uncovering variations and dispelling widely held myths.
UK, WWL NHS Foundation Trust
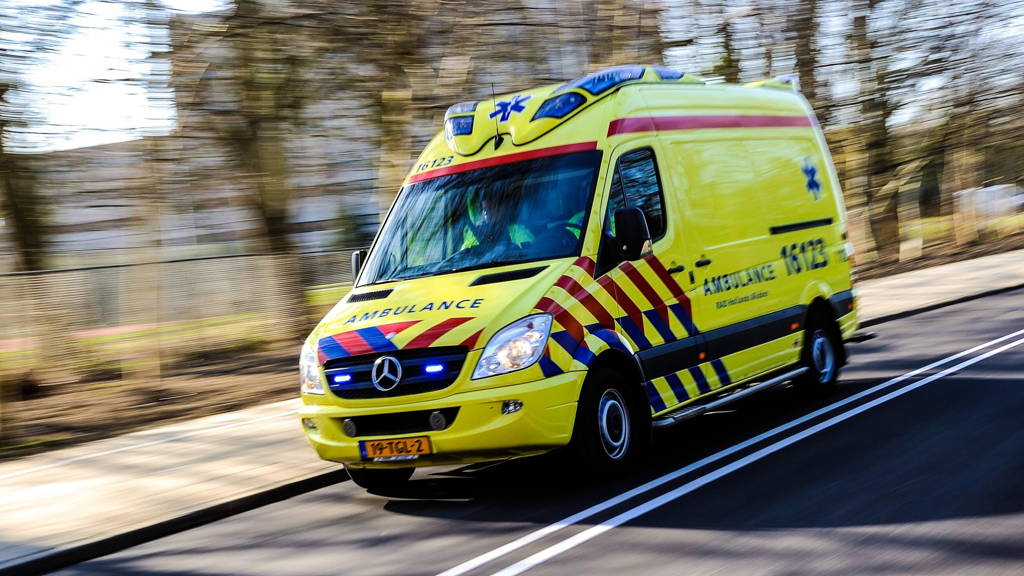
Wrightington, Wigan and Leigh (WWL) NHS Foundation Trust, like all NHS trusts is under huge pressure to decrease A&E waiting times. In a response to this challenge the trust has created an application that provides live A&E intelligence to all staff – doctors, nurses, clinicians and the board, giving a greater understanding of where patients are in their journey through the hospital - improving discharge levels, reducing delays and minimising re-admissions.By putting analytics into the hands of employees at the point of decision and empowering data-driven decisions to be made at all levels, its A&E department has been able to decrease patient waiting times by thirty minutes.
Netherlands, Security region Northern Holland
Veiligheidsregio Noord-Holland is an aggregated organization in the Netherlands comprising of the regional fire department, the GHOR (medical assistance), Ambulancezorg (ambulance care) and the Gemeenschappelijke Meldkamer (communal emergency control centre). One key insight showed that the further a citizen lived from a city, the worse the life expectancy forecast would be following a heart attack or stroke.By creating a dashboard and collaborating on data across all 19 communities in the region, the organization was able to reduce the total time from the first emergency call through to the life-saving operation by up to 20 minutes. Not only does this help save lives but means that the quality of life following the operation is improved as treatment commenced at an earlier stage.
Australia, New South Wales Health
New South Wales Health, covers all aspects of public health in New South Wales, Australia, and has been making strides to improve healthcare efficiencies across the region. Using visual analytics, NSW Health are delivering self-service analytics through the ABM Portal to the local health districts. By using and linking up financial, clinical and patient data they are able to deliver better health services to all, both for the short-term treatment, and long term care.Cultural Shift
Fantastic work is being done in pockets, David Bolton writes. What is needed now, is greater awareness for these success cases, enabling knowledge sharing and establishing best practice at a national, and international level.One of the main challenges is creating a culture of data literacy – the ability to not only read but understand, analyse and work with data – across the healthcare system. The ones that really deliver results are those that have clinicians as key stakeholders in the process and where the data is accessible and relatable to hospital staff from ward to board. That means approaching healthcare analytics from a 360-degree view perspective.
Healthcare analytics: prescription for change
With this in mind Qlik outlined the key criteria to help stakeholders create an enterprise-wide, sustainable and progressive environment for analytics:- A framework to ensure stakeholders properly embed analytics strategy within the wider organizational environment to generate value
- A value generation check-list outlining the critical factors in building pathways to tangible results
- Examples of healthcare organizations which have successfully generated value from analytics
This checklist is based primarily on lessons from the healthcare transformation, improvement and analytics front-lines as we’ve seen from these examples. However, a one sized approach does not fit all, and the best analytics strategies are those that are aligned to an organization’s specific characteristics, potential and limitations.